
When upgrading a Strata PC, consider model runtime, actual additional spending and memory capacity together. This article uses an i7-11700, RTX 5060 Ti 16GB and 64GB dual-channel DDR4-3200 as the baseline. It separates conditional predictions for original IQ3_XXS from measurements and historical costs for Swift 1.5 IQ2_XS.
Strata series: Model benchmarks · Performance formula · Upgrade costs and benefits
Compiled in October 2026. Prices are previously recorded valuations and bundle prices, not current in-stock quotes. Predictions are not guaranteed upgrade gains.
Original IQ3_XXS: how much time might hardware upgrades save?
The v4 formula keeps the Strata 0.1.41 nine-run medians: 1,666.44 Prefill and 51.30 Decode tokens/s. At 51,200 input + 4,096 output tokens, baseline time is 110.568233 seconds. Later 0.1.43.1 tests did not replace this calibration baseline.
These are point estimates, not hardware upgrades individually tested on the local PC. Positive “time saved” means faster; negative means slower. Decimal places help check the calculations, not imply equivalent prediction accuracy.
| Scenario | GPU link | Prefill tokens/s | Decode tokens/s | Calculated seconds | Time saved |
|---|---|---|---|---|---|
| Local baseline | 4.0 x8 | 1,666.44 | 51.30 | 110.57 | 0.00% |
| PCIe 5+5060 Ti | 5.0 x8 | 1,823.85 | 56.55 | 100.51 | 9.10% |
| DDR5-5600+5060 Ti | 4.0 x8 | 1,666.44 | 56.95 | 102.64 | 7.17% |
| RAM 128GB+5060 Ti | 4.0 x8 | 1,666.44 | 51.30 | 110.57 | 0.00% |
| RTX 3060 12GB | 4.0 x16 | 1,046.38 | 39.21 | 153.38 | −38.72% |
| RTX 5070 12GB | 4.0 x16 | 1,602.74 | 51.98 | 110.75 | −0.16% |
| RTX 5070 Ti 16GB | 4.0 x16 | 2,580.38 | 73.07 | 75.90 | 31.36% |
| RTX 5080 16GB | 4.0 x16 | 2,723.52 | 75.60 | 72.98 | 34.00% |
| PCIe 5+DDR5+5060 Ti | 5.0 x8 | 1,823.85 | 62.78 | 93.32 | 15.60% |
| PCIe 5+DDR5+5070 | 5.0 x16 | 1,725.76 | 62.50 | 95.20 | 13.90% |
| PCIe 5+DDR5+5070 Ti | 5.0 x16 | 2,778.43 | 87.86 | 65.04 | 41.17% |
| PCIe 5+DDR5+5080 | 5.0 x16 | 2,932.56 | 90.91 | 62.51 | 43.46% |
Main assumptions: DDR5 means dual-channel 5600 MT/s, with theoretical bandwidth of 89.6 GB/s. CPU capability is held at the i7-11700 score of 20,585 to isolate other variables. An actual DDR5 / PCIe 5 platform change requires a new CPU, whose score should be entered separately. Assumed H2D speeds are Gen4 ×8 = 13.8, Gen4 ×16 = 27.6, Gen5 ×8 = 28.5, and Gen5 ×16 = 50 GB/s. Only 13.8 GB/s was measured locally.
The RTX 5070-only result of −0.16% should be read as roughly unchanged. The 0% result for 128GB assumes no existing memory pressure, a RAM-resident hot working set, and unchanged frequency, channel count and data placement. Extra capacity can still accommodate larger models and more applications.
The v4 cross-machine synthetic-time mean absolute percentage error (MAPE) is 10.88%. This is an average validation error, not an error interval for each scenario. Differences of a few percentage points do not establish that one option will definitely be faster.
Swift IQ2_XS: historical costs, CPU scores and measured throughput
This section switches to Swift 1.5 IQ2_XS and cannot be directly combined with the original IQ3_XXS table. Local results are nine-run medians from October 11, 2026 on Strata 0.1.41; author results are single measurements on 0.1.26. Swift speed after the i5/i7 upgrades has not been measured. “Not yet measured” does not mean zero improvement.
| Item | Local Swift baseline | i5 upgrade | i7 upgrade | Author |
|---|---|---|---|---|
| Comparison cost (not consistent new-build prices) | NT$69,656 | NT$81,446 | NT$86,846 | NT$85,118 |
| Added comparison cost versus baseline | Baseline | +NT$11,790 | +NT$17,190 | +NT$15,462 (valuation difference) |
| Comparison cost change | Baseline | +16.9% | +24.7% | +22.2% |
| CPU | i7-11700 | i5-14400F | i7-14700F | Ryzen 5 7600 |
| Cores / threads | 8 cores / 16 threads | 10 cores / 16 threads | 20 cores / 28 threads | 6 cores / 12 threads |
| PassMark average single-thread score increase | Baseline | +13.7% | +30.7% | +20.0% |
| PassMark average multithread score increase | Baseline | +23.5% | +100.5% | +31.0% |
| Motherboard | PRIME B560M-K | TUF B760M-PLUS WIFI D4 | TUF B760M-PLUS WIFI D4 | Not disclosed; comparable-board price estimated |
| GPU | RTX 5060 Ti 16GB | Reused | Reused | RTX 5070 12GB |
| RAM | 64GB DDR4-3200 dual channel | Reused | Reused | 64GB DDR5-5200 (channels unconfirmed) |
| Theoretical peak RAM bandwidth | 51.2 GB/s | 51.2 GB/s | 51.2 GB/s | 83.2 GB/s (assuming dual channel) |
| GPU PCIe link | 4.0 ×8 | 5.0 ×8 | 5.0 ×8 | 5.0 ×16 |
| Theoretical one-way PCIe bandwidth | 15.8 GB/s | 31.5 GB/s | 31.5 GB/s | 63.0 GB/s |
| Prefill (32K test tier) | 1,622.10 tokens/s | Not yet measured | Not yet measured | 2,092.02 tokens/s |
| Prefill speed increase | Baseline | Not yet measured | Not yet measured | +29.0% |
| Decode (4K test tier) | 65.55 tokens/s | Not yet measured | Not yet measured | 78.60 tokens/s |
| Decode speed increase | Baseline | Not yet measured | Not yet measured | +19.9% |
| Time to prefill 51,200 tokens (estimate) | 31.6 s | Not yet measured | Not yet measured | 24.5 s |
| Input-processing time change | 0% | Not yet measured | Not yet measured | −22.5% |
| Time to generate 4,096 tokens (estimate) | 62.5 s | Not yet measured | Not yet measured | 52.1 s |
| Generation-time change | 0% | Not yet measured | Not yet measured | −16.6% |
| Total LLM input + output time (estimate) | 94.1 s | Not yet measured | Not yet measured | 76.6 s |
| Total LLM time change (used in chart) | 0% | Not yet measured | Not yet measured | −18.6% |
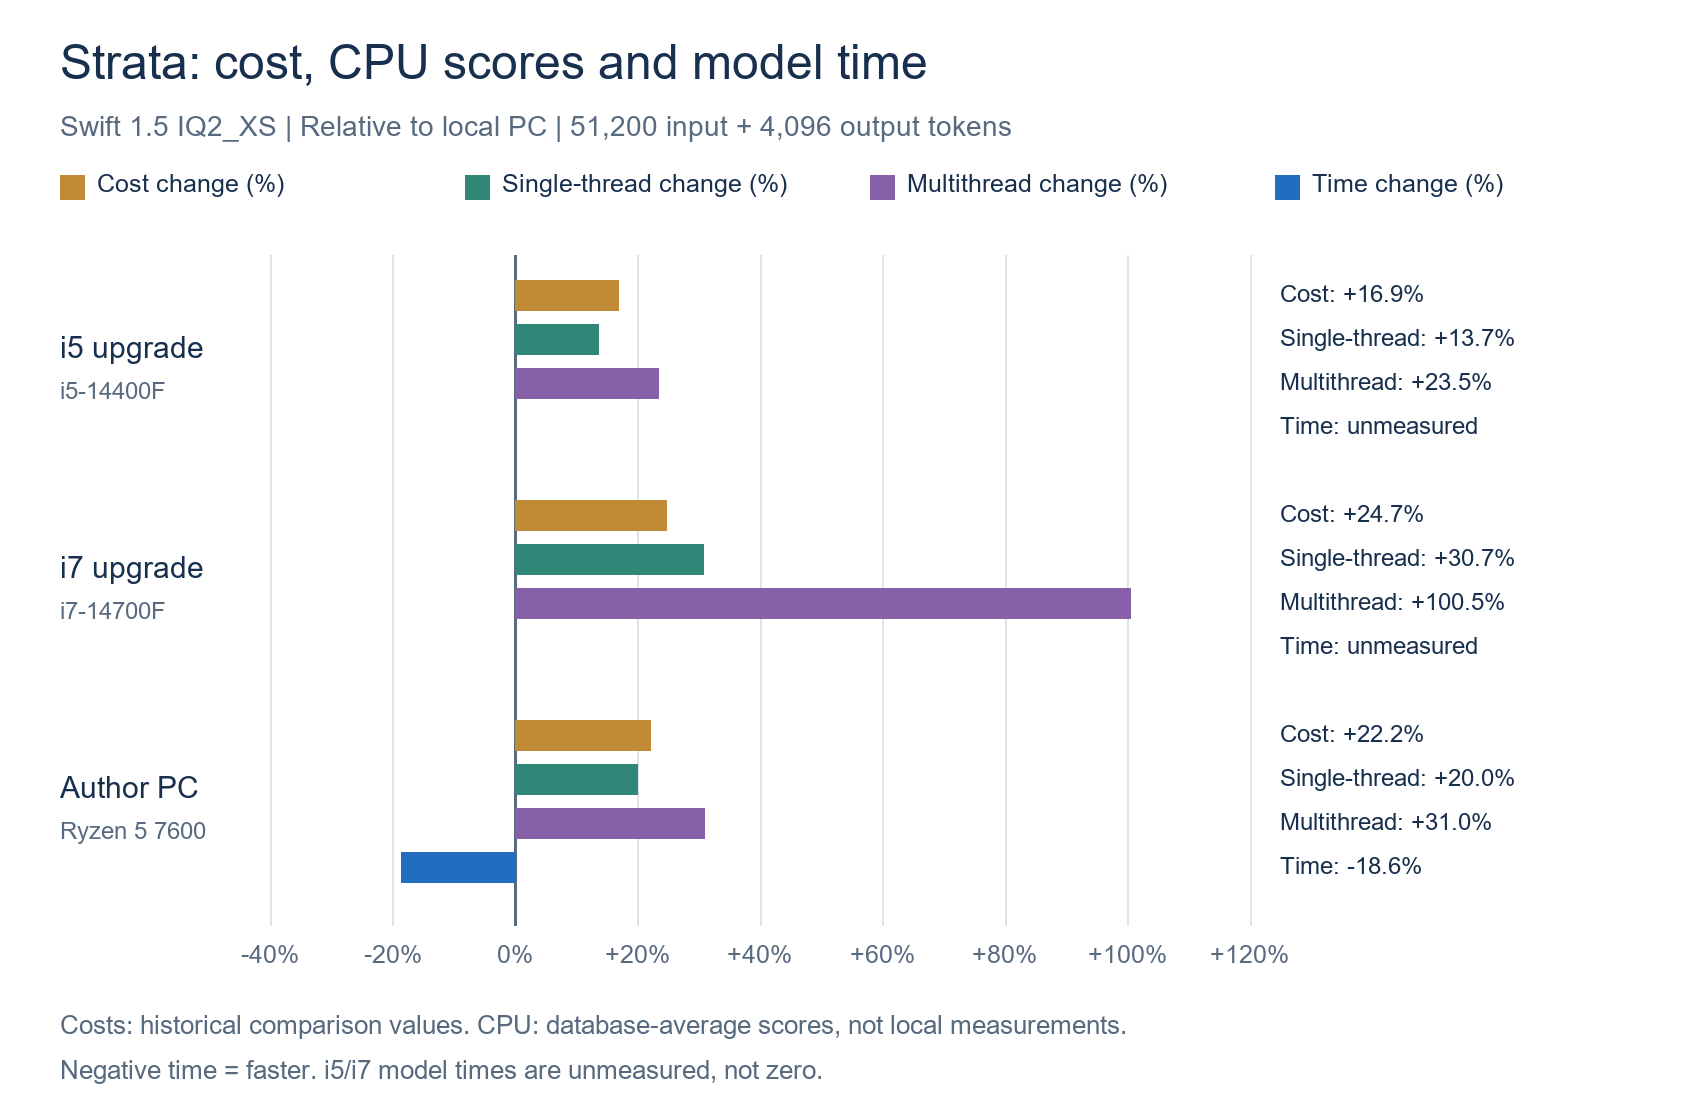
Cost basis: includes one 2TB M.2 SSD and excludes HDDs. Historical i5/i7 bundle spending of NT$11,790 / NT$17,190 is added to the original configuration’s new-parts valuation of NT$69,656, without deducting old CPU/motherboard value or resale proceeds. The author’s NT$85,118 is a comparable complete-system valuation using substitute parts, not an actual purchase price. The four columns therefore do not use a consistent new-build purchase-cost basis.
CPU gains are PassMark database averages, not benchmarks measured on these four PCs, and do not imply the same Strata gains. The author’s DDR5-5200 channel configuration is unconfirmed; 83.2 GB/s assumes dual channel. Although both models are labeled Swift 1.5 IQ2_XS, engine versions, MTP vocabularies and prompts differ; the author also did not record model-file SHA hashes. Actual prompt lengths for the nominal 32K / 4K tiers were 31,566 / 3,562 tokens.
Early estimates for original IQ2_XS were about 2,000 / 73 tokens/s for i5 and 2,000 / 77 for i7 (Prefill / Decode). Those historical estimates do not apply to Swift and are intentionally absent from the table.
Why use 51,200 input + 4,096 output tokens?
TraceLab’s published research reports 2.34 billion uncached input tokens and 186.9 million output tokens, an aggregate ratio of about 12.52:1. Here it is rounded to 12.5:1; keeping 4,096 output tokens as the comparison scale gives 51,200 input tokens. Input excludes cache hits and includes recomputation after cache invalidation. Output includes reasoning, tool calls, code and answers.
This is a scenario normalized to an aggregate ratio, not the average per round or per coding-agent task. The study uses Claude/Codex rather than local Qwen. Cumulative input is not the context length of a single round.
Synthetic time T = 51,200 / Prefill + 4,096 / Decode
Time saved (%) = (1 − T / baseline time) × 100%
Time change (%) = (T / baseline time − 1) × 100%
The two percentages have opposite signs. The first table uses time saved; the Swift table and example below use time change. Calculations use unrounded values, so displayed time components may differ from the displayed total by 0.1 seconds.
These times use fixed 32K Prefill and 4K Decode rates, without adjusting each round for context length. They exclude tools, compilation, testing, networking, scheduling and additional summaries. They compare a fixed model workload, not end-to-end coding-agent task duration. More precise estimates require per-round benchmarks at matching context lengths.
Historical bandwidth example: what if waiting accounts for 24.1%?
This only illustrates Amdahl’s law. It is neither a v4 prediction nor an upgrade measurement. The baseline switches back to 94.1 seconds for Swift IQ2_XS.
| Configuration | Assumed waiting share | Total model time | Seconds saved | Time change |
|---|---|---|---|---|
| Current: PCIe 4.0 ×8+DDR4-3200 dual channel | Baseline | 94.1 s | — | — |
| PCIe 5.0 ×8+DDR4-3200 dual channel | PCIe waiting 24.1% | 82.7 s | 11.3 s | −12.1% |
| PCIe 4.0 ×8+DDR5-5200 dual channel | DDR waiting 24.1% (additional assumption) | 85.3 s | 8.7 s | −9.3% |
| PCIe 4.0 ×8+DDR5-6000 dual channel | DDR waiting 24.1% (additional assumption) | 83.5 s | 10.6 s | −11.2% |
| PCIe 5.0 ×8+DDR5-5200 dual channel | PCIe and DDR 24.1% each; total 48.2% (assumed non-overlapping) | 74.0 s | 20.1 s | −21.3% |
| PCIe 5.0 ×8+DDR5-6000 dual channel | PCIe and DDR 24.1% each; total 48.2% (assumed non-overlapping) | 72.1 s | 21.9 s | −23.3% |
The 24.1% comes from DALI’s PCIe transfer share. This calculation additionally assumes all of it is waiting that scales with bandwidth and is not overlapped by other computation. Applying the same share to DDR is unsupported by research or local measurements. The combined scenario further assumes PCIe and DDR each account for 24.1%, with no overlap, totaling 48.2%. Actual overlap would make this calculation overestimate gains.
One factor: Tnew = Told × (1 − 0.241 + 0.241 / bandwidth multiplier)
Combined: Tnew = Told × (1 − 0.241 − 0.241 + 0.241 / 2 + 0.241 / DDR multiplier)
PCIe, DDR5-5200 and DDR5-6000 multipliers are 2, 1.625 and 1.875 respectively, assuming effective bandwidth increases in direct proportion to theoretical bandwidth. CPU replacement effects are excluded. Each row independently compares against the baseline; these results are not additional gains to add to the first table.
How should you decide whether an upgrade is worthwhile?
First determine whether RAM is insufficient, then weigh actual additional cost, usage frequency and time saved. Without Swift measurements for the i5/i7 bundles, CPU scores alone cannot settle the choice. The v4 RTX 5070-only estimate is roughly unchanged and does not establish a reason to upgrade. Higher-end GPUs predict larger savings, but these conditional estimates should guide testing rather than serve as purchase guarantees.
Sources
- The Strata author’s 0.1.26 speed tests, raw results and technical documentation.
- PassMark: i7-11700, i5-14400F, i7-14700F, Ryzen 5 7600. Single-/multithread scores recorded on October 11, 2026 were respectively 3,255 / 20,583; 3,700 / 25,413; 4,254 / 41,262; and 3,907 / 26,959. This snapshot differs from the v4 fixed baseline of 20,585.
- Historical bundle sources: PChome i5-14400F bundle and i7-14700F bundle. This article does not claim these prices or stock remain available.



Discussion